What is Heat Maps
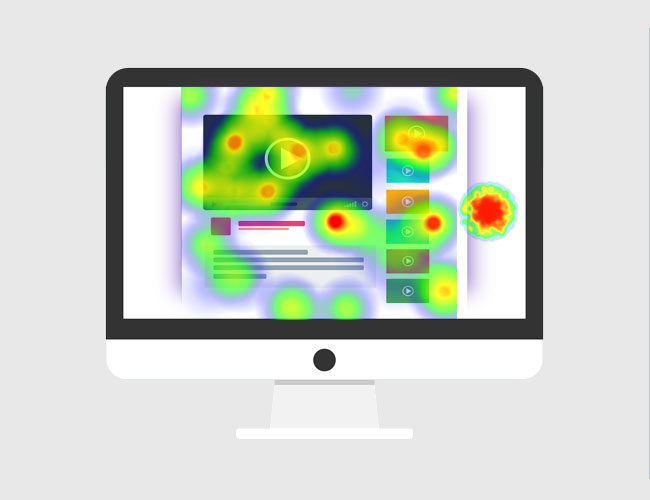
Heat map on the other hand is a graphical representation of data where figures displayed are shaded differently based on values.
Schedule Your Demo With Our Experts
By filling out and submitting this form, you acknowledge and agree to the Terms of Use for SIRIXO services, solutions, and products.

Why Are Heat Maps Needed for a Website?
Heat maps play a critical role in the analysis of visitor behavior on website. It shows and gives information on what particular pages visitors interact with hence gives a business means to change the layout, make improvements that will enhance the experience of the users and subsequently increase the conversion rate.
24
Years of
experience
Our Features
How it Works
How Do Heat Maps Work
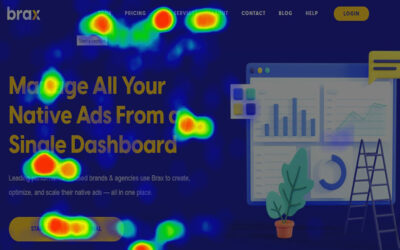
Heat maps are used to show the level of activity on a website or an application through representations by colors on a gradient. They record, through tags embedded or tracking tools, activities such as a click, scroll or hover. This data is presented as map and the red areas suggest high activity while blue colors represent less activity.
The process is based on gathering real time user activity information and then superimposing it over the site map. For example, wanted areas are highlighted in red or orange whereas not frequently clicked areas in blue or green. This kind of presentation allows seeing the preferences of users and adjusting the necessary points more efficiently.
Maps of hot areas are crucial if you need to enhance usability and results achieved by a web resource. They make it easier to understand the ideal areas such as ‘call to actions’ buttons base on their performance and the areas that require improvement. It would be out of place for such insights not to be found useful by a business in improving navigation, strategic positioning of content and even overall layout of the business’ website for higher performance.

WE USE FOCUSED STRATEGY, CREATIVE DESIGN, AND INNOVATIVE TECHNOLOGY
We develop using the latest technologies
available on the market
Case Studies
Discover Hidden Patterns and Optimize Your Strategy.
Try Now!
Our Pricing
Package
Page Views
Heat Maps
Domains
Support
Features
Basic
Standard
Premium
Frequently Asked Questions
What is a heat map in website analytics?
A heat map in website analytics is simply a graphical user interface that displays an image of the website with traffic patterns noted according to the intensity of the color on the map. It assists in making decisions concerning user interaction with a webpage.
How do heat maps work on websites?
To make heat maps, tracking scripts are embedded to monitor activities such as clicks, scrolling and movement of the mouse. Finally, data is presented in thematic maps to reveal areas of interaction based on the shade of colors used.
Why are heat maps important for websites?
Heat maps in the business context serves to determine the areas to place certain chunks’ on the business website in order to offer customers or visitors the most optimal experience required to take on the desired action or navigate the site.
What are the types of heat maps?
- Click Heat Maps: Track where users click.
- Scroll Maps: Show how far users scroll.
- Hover Maps: Indicate mouse movement.
- Attention Maps: Highlight areas receiving the most focus.
Which tools are best for creating heat maps?
Some of the most common ones include; Hotjar, Crazy Egg, Mouse flow and Google Analytics if you want to create heat maps and understand the behaviour of users.

Our Valuable Clients
Navigating User Behavior
Updates and Trends in Heat Mapping
Need a Quick Query?
It would be great to hear from you If you got any questions, We are looking forward to hearing from you We reply within 24 hours
Talk to Us
We'd love to talk about your project
Our experts and developers would love to contribute their expertise and insights to your potential projects


