Introduction
In today’s data-driven world, businesses are constantly seeking ways to gain insights, make informed decisions, and stay ahead of the competition. One powerful tool that has emerged to address these needs is heat maps. These graphical representations of data offer a visually compelling way to understand complex information and uncover hidden patterns. In this blog, we’ll delve into the importance of heat maps and how they can empower businesses to unlock the full potential of their data.
What are Heat Maps?
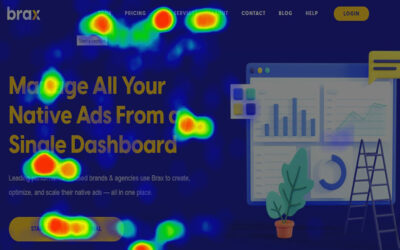
At their core, heat maps are visual representations of data where values are depicted using color gradients. The intensity of color indicates the concentration or density of data points in a particular area. Heat maps are commonly used to analyze spatial data, such as website traffic, customer demographics, sales performance, and more.
The Importance of Heat Maps
Instant Insights: Heat maps provide instant insights into data patterns and trends, allowing businesses to quickly identify areas of interest or concern. With a glance at a heat map, users can grasp complex information and make data-driven decisions more efficiently.
Visual Clarity: Visual representations, such as heat maps, offer clarity that raw data tables or charts may lack. By presenting data in a visual format, heat maps make it easier for users to interpret and understand complex information, leading to better decision-making.
Identifying Hotspots: Heat maps excel at highlighting hotspots or areas of high activity within datasets. Whether it’s identifying popular website pages, high-traffic retail locations, or densely populated regions, heat maps make it easy to pinpoint areas of interest and focus attention where it’s needed most.
Detecting Trends and Anomalies: By visualizing data over time, heat maps can help businesses detect trends, fluctuations, and anomalies. Whether it’s identifying seasonal sales patterns, spotting sudden spikes in website traffic, or detecting unusual customer behavior, heat maps can uncover valuable insights that may otherwise go unnoticed.
Enhanced Communication: Heat maps serve as powerful communication tools, allowing businesses to convey complex information in a visually engaging manner. Whether it’s presenting data to stakeholders, sharing insights with colleagues, or explaining findings to clients, heat maps facilitate clearer and more compelling communication.
Optimizing User Experience: Heat maps play a crucial role in optimizing user experience by providing valuable insights into how users interact with websites, applications, or products. By analyzing heat maps of user interactions, businesses can identify usability issues, optimize navigation paths, and enhance overall user satisfaction.
Improving Marketing Strategies: Heat maps offer valuable insights into the effectiveness of marketing campaigns and strategies. By analyzing heat maps of website traffic, click-through rates, or social media engagement, businesses can assess the impact of their marketing efforts, identify areas for improvement, and refine their strategies accordingly.
Conclusion
In conclusion, heat maps are invaluable tools for businesses seeking to harness the power of visual data. By providing instant insights, visual clarity, and the ability to identify hotspots, detect trends, enhance communication, optimize user experience, and improve marketing strategies, heat maps empower businesses to make smarter, data-driven decisions. Whether it’s optimizing website performance, analyzing customer behavior, or refining marketing strategies, heat maps offer a powerful means of unlocking the full potential of data. So, if you’re looking to gain a competitive edge and stay ahead of the curve, it’s time to embrace the power of heat maps and unlock the hidden insights within your data.
Search
Categories
- AI 2
- Analytics & Data Science 3
- bioenerga.gr 2
- Blogs 7
- Brand Identity 14
- Business 5
- Business news 1
- casino 5
- CMS & LMS 23
- Digital Marketing 13
- Digital Signage 9
- E-commerce 6
- Echalk 1
- Education & E-Learning 1
- Education IT Solutions 1
- Events 2
- Food Delivery 1
- Forex News 2
- General 1
- Internet of Things 8
- Metaverse 1
- Mobile App Development 14
- Mobile Στοίχημα 1
- News 4
- Open Source Development 13
- public 48
- Software 2
- Uncategorized 3,367
- Web Design 1
- Web Development 18
- Web Security and Performance 12
- Website Development 2
- WordPress Development 1
- Κουπόνια Προσφορών 1